
Elcomsoft Quick Triage 2.2: Timeline, file system snapshot, and a plugin engine
September 3rd, 2026 by Oleg AfoninCategory: «General»
Elcomsoft Quick Triage 2.2 adds three things: a Timeline view that merges events from every timestamped artifact into one chronology, a file system snapshot that copies metadata without file contents, and a plugin architecture for artifact parsers. The release also brings MSA password attacks, OpenDocument parsing and recursive archive parsing in full-text search, and a list of fixes, but here we’ll mostly talk about the first three.
The Timeline
A forensic timeline takes every artifact that carries a time stamp, normalizes those stamps to one axis, and sorts them. Instead of opening the browser history, then Prefetch, then the USB registry keys, and mentally interleaving three tables, you read one list in order. Elcomsoft Quick Triage has been able to filter individual artifacts by date for a while; the Timeline is a separate view that puts all of them together. It covers six event groups: browser activity (visit history and downloads), network activity (data usage from SRUM and the list of networks the PC connected to, from the registry), recent files and folders, application user interaction from Jump Lists, device activity (USB devices, Bluetooth, microphone and webcam use), and program execution from the BAM registry branch and Prefetch. The idea is familiar from the timeline views in the large forensic suites. What is new here is that it runs against data EQT has already collected, in the same window, with no export and no second tool.
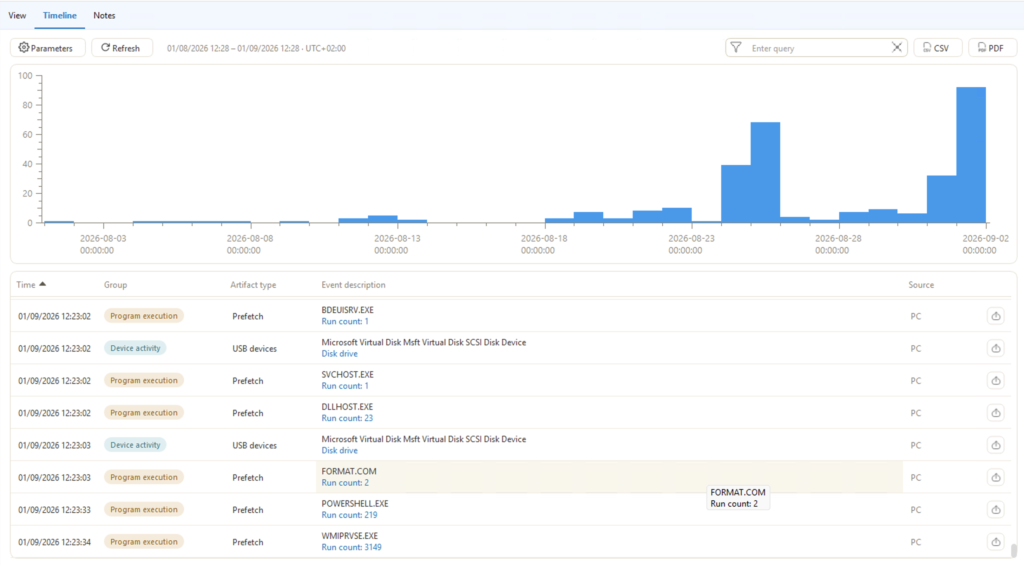
The histogram is the part you will use first. It shows the shape of the activity before you read a single row: in the screenshot above, a month of near-flat bars, a spike of about 68 events around 25 August, and a taller one at the tail. Click a bar, get the rows. The event table gives you time, group, artifact type, description and source; quick filtering narrows it; and clicking an event opens its card next to the table, so you get the artifact’s full field set without leaving the view. In the screenshot below, the USB Input Device card resolves to a QEMU USB Tablet, driver version 10.0.26100.8972, first installed 15/05/2026 21:27:59, last attached 25/08/2026 10:05:56. From any event you can jump to the source artifact. Export is available in PDF and CSV.
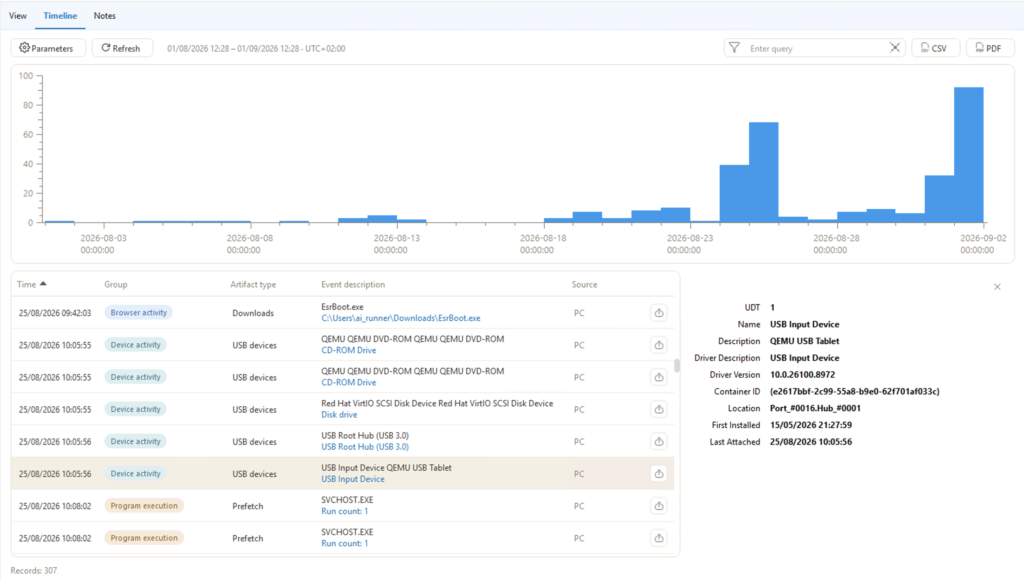
Timeline generation is configurable. The parameters dialog selects the sources, switches the six groups on and off, picks which volumes contribute file system events, chooses the time stamp used to generate those events (creation time in the screenshot), applies a file name mask, and sets the interval, with presets for 24 hours, 7 days, 30 days, half a year, a year, and the whole period. The 24-hour window in our test image produced 307 records; adding a volume to it will produce a great deal more.
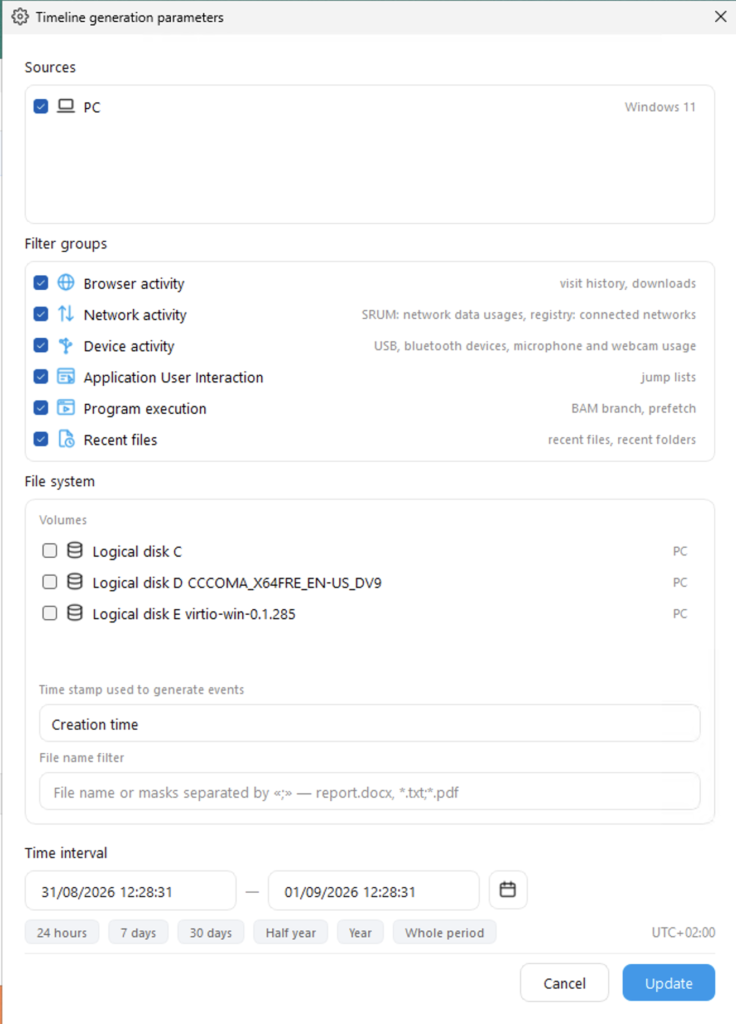
A word of caution about reading any timeline. The stamps on the axis do not all mean the same thing. BAM records a last execution time. Prefetch keeps a run count and the most recent run times. USB registry keys record a last connection. Recent files carry a last access time. Two rows a second apart may be one action or two unrelated ones, and a single row can stand for hundreds of executions: in the third screenshot, WMIPRVSE.EXE shows a run count of 3149 and POWERSHELL.EXE 219, while FORMAT.COM shows 2, and the axis carries only the latest stamp for each. The display uses a fixed offset, UTC+02:00 in these shots, so check it before you quote a time in a report. File system events use the one time stamp you selected, so they are not a four-value MACB timeline. The Timeline is a tool for orientation and for finding leads; the jump-to-source button exists because the source artifact is what you cite.
Do you need a full disk image?
Short answer: sometimes, and the file system snapshot is for the rest of the time. We copy file system metadata without the contents of the files: names, paths, sizes, creation and modification times, for everything on the selected volume. The result is a virtual file system you can browse on another computer. You can see what was on the disk and where it sat, search by name or mask, filter by date, and sort by creation or modification time. You cannot see what was inside any file except those collected as artefacts.
The feature sits between two things. A full disk image is complete and defensible, but you will need a destination drive as large as the source, hours of acquisition, and more hours of analysis. Artifact collection is fast and small, and it gives you the evidence with the context stripped off: you get the browser database and the Prefetch files, and you never learn that the suspect kept 400 files in the folder next door, that a directory was created the same afternoon as the download you are looking at, or that something you expected to be there is missing. Metadata costs bytes per file, so the snapshot restores that context for a small fraction of the size of an image. The closest thing you already know is an MFT listing or a bodyfile from fls, presented as a navigable tree with search and filters instead of a CSV. The limit is obvious: if you need to carve, hash, or read content, you still need the image or a targeted file collection. The snapshot is a record of the file system, and it does not replace the full image.
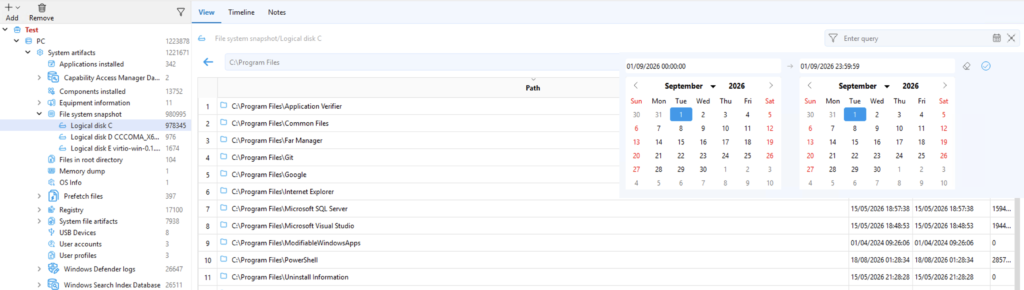
In practice the snapshot answers questions you would otherwise leave open until the lab work is done. Was this file name ever present on the machine? What else was created in the 40-minute window the Timeline flagged? What sat around the artifact you care about? Which directories have time stamps that do not fit the rest of the volume? The date filter takes a range with a start and an end, down to the second, and the search runs across the whole volume. The two new features connect here: in the Timeline parameters, snapshot volumes can be switched on as an event source, and file system events then land on the same axis as the browser and execution artifacts.
Plugins
Artifact types are now plugins. This is an engine change with nothing to click, and the payoff is delivery speed: six artifacts arrived on the new mechanism in this release, including Microsoft Defender logs, the Windows Update Store, the Capability Access Manager database, Jump Lists, the Windows Search index, and Prefetch. Several of those feed the Timeline, which is why the two features shipped together.
We are considering publishing the plugin API, so that a lab with development resources can write its own parsers. Second, we’re thinking about artifacts on demand: if you need support for a specific application, we could build the plugin and ship it to you without waiting for the next release. Neither is a commitment yet. If there is an artifact you keep parsing by hand, tell us which one.
REFERENCES:

Elcomsoft Quick Triage
Elcomsoft Quick Triage is a tool designed to rapidly extract and analyze the most important evidence from a target computer or disk. It is equally effective during on-site operations and in laboratory environments, helping investigators make informed decisions at the earliest stages of an investigation.

- iOS Forensic Toolkit 10.12: bootloader extraction for the Apple HomePod mini9 October, 2026
- Elcomsoft Phone Breaker 11.05: iCloud extraction support for iOS 27 and the iPhone 18 range6 October, 2026
- iOS Forensic Toolkit 10.11: bootloader extraction for Apple Watch Series 4 and 5, Apple TV 4K 2nd Gen21 September, 2026
- Elcomsoft Quick Triage 2.2 adds a timeline, a plugin system, and file system snapshots3 September, 2026
- Elcomsoft System Recovery 8.38: Built-In BitLocker TPM Exploit Library, Browser Artefact Extraction, and Imaging Checksums26 August, 2026